MACD
By TechGuy - December 03, 2017
MACD stands for Moving Average Convergence Divergence, and is an indicator designed to detect momentum change and signal overbought or oversold conditions. It is made up of two parameters: the ‘MACD line’ showing the difference between 12 and 26 period EMA, and the ‘signal line’ showing the nine day EMA of the MACD line. Sometimes it also contains a histogram which gives a visual representation of the difference between the MACD line and the signal line. Overbought and oversold signals are generated when the MACD line moves far above or far below the signal line - the higher above the signal line the MACD line is, the more overbought the currency, the lower below the signal line, the more oversold the instrument.
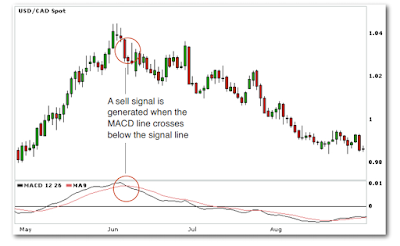
Aside from showing overbought and oversold conditions, MACD also gives signals when the signal line and the MACD lines cross over each other. The MACD line crossing above the signal line is a buy signal, and crossing below is a sell signal.
Finally, you can also get important information by looking at the slope of the MACD line relative to the price trend. Most often, they will move up or down in tandem, but occasionally they will either converge towards each other or diverge away from one another. When you see the price moving higher while the MACD is moving lower, this is a signal that the trend is weakening, and that we may even see a trend reversal soon. The reverse also holds that when the price moves lower while the MACD moves higher, then the signal is that the trend is weakening.


1 comments
The holidays schedule can be used to help you organise your trading activity as you can find out which of the world's markets will be open and closed on certain dates.
ReplyDelete