1. Define your trading strategy
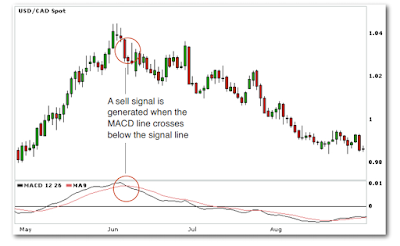
A consistently successful trader always has a defined trading method. Guessing or going by your gut doesn’t always work. Without a defined trading method there is no way for you to know what constitutes a buy or a sell signal, or to even consistently identify the trend. Decide what your method is, which technical indicators or other tools (e.g. candlestick analysis, etc.) you will use, what your buy or sell signals are, and finally define how you plan to exit a position, with a take profit and a stop loss in place.
2. Be disciplined
Once you have defined a method or a system that works for you, follow it. It is important to stick to the levels you selected for your stop loss and your take profit, always targeting a larger profit than the amount you are willing to lose. Adding to your margin and moving your stop loss further is likely to result in larger losses. Your stop loss should be placed at a level where you can accept that the market has moved against you and you are willing to take the loss.
3. Be realistic with your expectations
The goal for every trader in their first year of trading should simply be to stay in the game. You can’t experience above-average returns without exposing yourself to above-average risk and as a new trader you should not take on more risk. Remember, you should only risk what you can afford to lose. So be realistic with the stop loss and take profit limits you set.
4. Be patient
Markets trend only 20-30% of the time, and the rest of the time they are not moving in one clear direction. This means that you need to be patient, and wait for trends to form and give you good trading opportunities. For example, if you’re a medium-term trader, there will usually be only two or three good trading moves in the market in any given week. All too often, because trading can be so exciting, new traders want to trade all the time. But this means you are probably over-trading, and doing it at a much lower standard too. Patience is important, so be prepared to wait and stick to your trading strategy.
5. Manage your money effectively
This is a very important point, and it explains why many traders lose the balance in their account after just a few trades. While new traders may risk half or even their entire free balance on one trade, experienced traders tend to limit their risk on any given position to 1- 5% of their portfolio. If we apply this rule to ourselves, then for every $5,000 we have in our trading account, we can risk only $50-$250 on any one trade. If you have a small trading account, then trade small, or top it up so that you can trade the deal sizes you want.


